Every once in a while I encounter someone who thinks that maths gets unreliable somewhere just past addition and subtraction.
Long ago a physicist friend told me a problem in Physics is not that the math is insufficent, rather that it can describe the physically possible and impossible with equal ease.
In the area of electronics called AC theory the maths of components and signals is now so well established that it exceeds the capabilities of real components.
“If you say theory and practice don't agree, you haven't applied enough theory” - Theo VanBemmel, Electronic Instruments.
Just as deeper knowledge of music theory can enrich a songwriters palette, so a better understanding of the maths behind signals can enrich technicians, musicians and sound engineers works.
As part of working on a design for (yet another) Leslie speaker simulator I wanted to take a closer look at the actual signals produced by a classic Hammond B-3 and Leslie rotary speaker combination.
The tonewheel generators in the Hammond nominally produce a sinewave signal, but selected musical intervals are mixed using drawbars to set individual component levels, so the output is far from a pure sinewave.
The French mathematician Jean Baptiste Joseph Fourier (1768-1806) discovered that a wave of any shape could be decomposed into sinewaves of different frequencies, amplitudes and phase relation.
Today we use Fast Fourier Transforms or FFT's running on computers to grind the math to display frequency spectra of signals. Similarly, some keyboard synths reverse the process and use additive synthesis to produce complex tones by adding together basic sinewaves.
So I took a ten second sample from an early track on the Santana “Lion's Head” album, and using Creative Studio I isolated about 1 sec of classic Hammond tone from this sample.
Click to hear 19kb 1.7s WAV
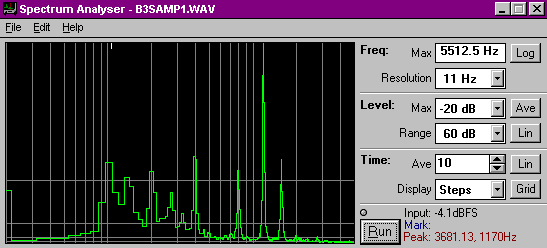
Just looking at it in the time domain doesn't tell you a whole lot, so next I did a spectral analysis to see it in the frequency domain using Paul Kellet's Wavetools Spectrum Analyzer.

The spectrum was saved as a table from which I chose these more obvious formants:
Hz      counts
96.9	1332.55
193.8	1196.20
387.6	1438.03
786.0	1204.39
1173.6	3414.80
1561.2	1379.30
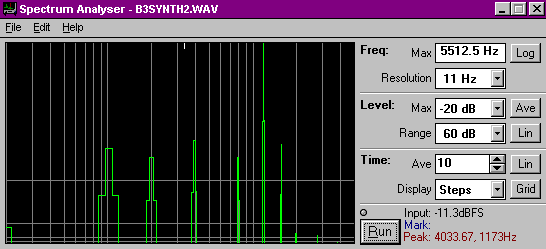
These were plugged into program I wrote in QBasic that uses SIN() statements to generate a .WAV file.
Click to hear 11kb 1s synth1 WAV
Note the roughly sawtooth shape of the wave.
While this looked similar to the original, and even sounded like the original, there is something of the Hammond magic missing. In fact, compared to the original with it's reverberation, percussion and all-important Leslie, the synthesis is pure cheeze more in keeping with a Farfisa of the period.
One of the characteristics of the Hammond voice are some bright high-end formants. Going back to the format list there were two little peaks of around 5% between 2 and 3kHz, so these were added in.

Click to hear 11kb 1s synth2 WAV
The result is a bit less cheeze and a bit more Hammond.
This process can be continued until the tone is a perfect reproduction of the original, however the point here was to gain some insight into the signals coming out of the organ into the Leslie speaker.
So we can see that while there can only be a single signal voltage at any given instant, how it varies over time contains all the information of the original formant parts.
Be they individual tone generators or instruments in a band, the result is always a single voltage or pressure level in the air.